
The Analytics page allows Admins to view more detailed information about the usage of their IXN products. The default information shows stats for the last month, but information can be viewed up to the last 90 days.
Start by logging in to the Dashboard as an Admin and navigating to the Analytics section.
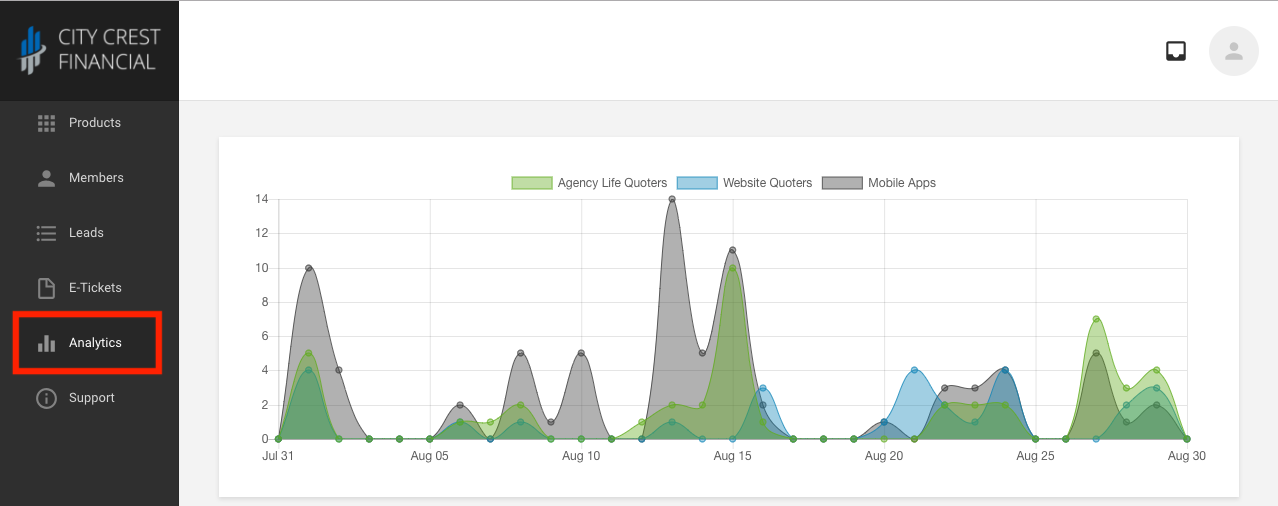
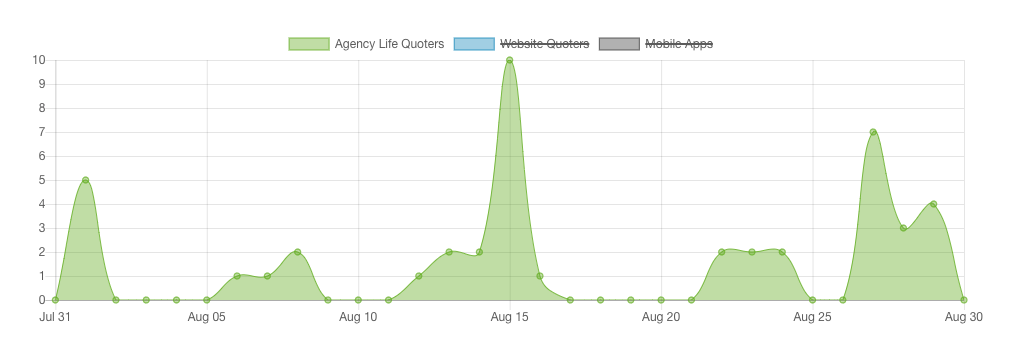
There you will see first a graph at the top of the page With a snapshot of all quotes run for all your IXN Products for the month. Hovering over points on the graph will show how many quotes were run on that product that day. You can also remove products from the view.
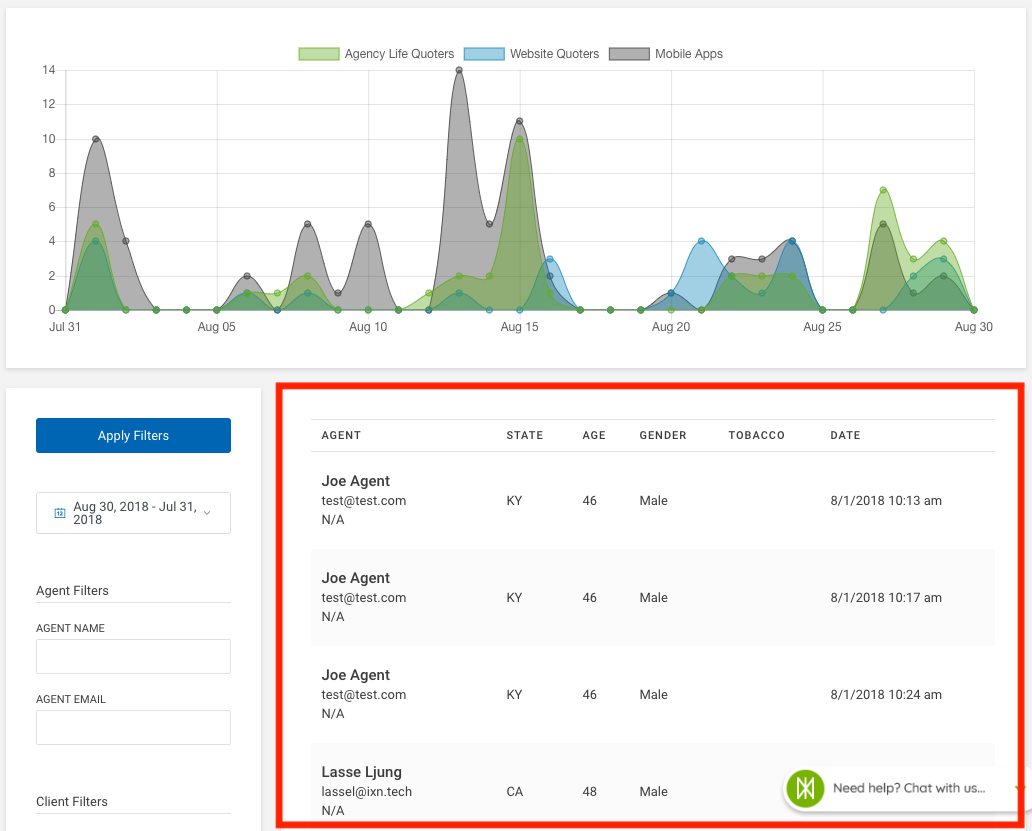
In the body of the Analytics page you can view details for each quote run. Clicking on the quote info will bring up a modal with even more quote details.
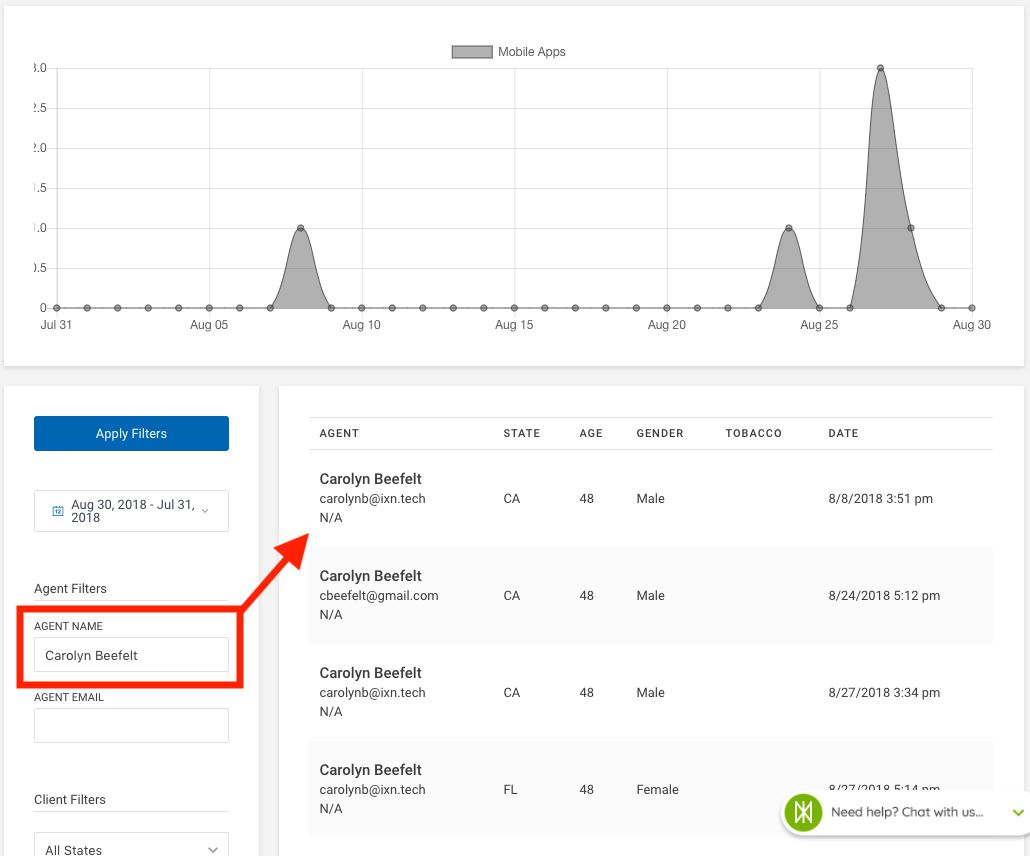
You can apply filter to change what is displayed in the quote info and graph. The filters are a great way to find more information on how agents are using your tools. Here is an example of filtering by Agent Name:
Questions or feedback? Feel free to reach out to our Support Team at support@ixntech.com or call 800-250-5152 #2.